Showing posts with label Analytics Synergy. Show all posts

Wednesday, February 21, 2024

How We Replaced an Implementation of Workday Adaptive Planning Enterprise Management with Microsoft’s PowerBI Tailored for FP&A Reporting

Excel’s powerful capabilities, integrations and flexibility make it a favored tool for all financial and accounting professionals. Like many middle market companies, we considered moving from an Excel dominated financial planning and reporting process to an “enterprise grade” solution. A very difficult decision, we set aside Excel for a unified financial planning tool, also known as Enterprise Planning Management (EPM) systems.

Salvatore Tirabassi

After a review of solutions and recommendations, we decided to move our financial planning to Workday’s Adaptive Planning (WAP). Our financial forecast in Excel is a complete system: It handles recurring revenue waterfalls, consolidations by products and business units, eliminations between business units, balance sheet forecasting, among other complexities. Nevertheless, the transition, despite a good plan on paper, became never ending.

We faced two core problems, which we thought we could overcome. First, the precision and complexity of our Excel forecasting model was hard to replicate in WAP. Second, our lack of deep knowledge in WAP modeling, forced heavy reliance on consultants and a time-consuming iterative process to make any headway.  To minimize the obstacles and make some use of WAP, we paused our forecasting transition efforts and focused on WAP as a reporting tool. We had modest success, but we ended up having a hodge-podge system of exceptions and frequent error checking that was worse than the status quo.

During this failed transition period, the analytics team, which is part of our finance team, dramatically increased its expertise and capabilities in PowerBI. (While I am going to focus on PowerBI, I encourage the finance pros reading this to think about this solution using whatever business intelligence platform that is available. This should work with any BI platform.) PowerBI’s integrations with Excel and our accounting system (Microsoft NAV) provided the light-bulb moment for moving forward with an in-house automated financial reporting system connecting our Excel forecasts to accounting results and producing polished reporting in real-time.

In order to get there, we assigned a skilled data analyst to work directly with accounting and FP&A to create an ETL (extract, transform and load) template in PowerBI that could take our GL-coded accounting records and match them to financial reports that were business friendly and consistent with our forecasting templates. Here are the key success criteria that made this possible.

  1. Our data analyst had PowerBI, SQL skills needed for the entire buildout.

  2. We were lucky that our data analyst also had solid accounting/finance knowledge to work directly with FP&A and accounting teammates. However, this could have been another team member working in tandem.

  3. The financial reporting templates were already matched to our excel forecasting outputs. This line-for-line matching eliminated the need for another ETL template, but that could have been created if necessary.

  4. Our data analyst spent time mapping GL codes to our financial reporting templates. Without this, the ETL development would have been impossible.

  5. In addition, the data analyst methodically mapped our eliminations entries between subsidiaries and hierarchical entities.

  6. Then, it was time for record matching so that financial reporting template, forecast and GL Codes could be connected in sample data with a clear line of sight to each other.

  7. Finally, the ETL template was ready to be programmed and tested.

  8. PowerBI reporting dashboards were then developed and tested with initial data flows. Here the finance team compared PowerBI financial reports to our previous reports. Checking for accuracy at the line-item, subtotal, and total levels. Any errors were traced all the way back to GL-codes to ensure the fixes could be implemented in the ETL template.'

  9. We then iterated step 8 until multiple periods showed no errors and everything tied out to the most important GL line items such as net income, fixed assets, total revenue, cash balance in every grouping variation we needed (e.g., consolidated, product, business unit, geography, etc.).

The above process took about 120 days to get through Step 8 and then another 60 days (2 reporting cycles) to get through Step 9. All of this was achieved with one resource dedicated to the project and all other FP&A and accounting teammates being on call as needed.

With our financial reporting now published in an automated way, we have dramatically reduced the processing time and eliminated exceptions handling for information flows from accounting to financial reporting. While the EPM also promised financial modeling automations, we never went back to that. Instead, we have improved our Excel-based forecasting models in ways that would be hard to replicate in a new system given the resources we have and the connections of these models to our PowerBI reporting system.

If you are considering an EPM, especially for reporting, it might be worth looking at your existing business intelligence platform for an easier and more manageable solution.

Reference: https://salvatoretirabassi.substack.com/p/how-we-replaced-an-implementation


Wednesday, February 14, 2024

Cracks in Consumer Credit Card Delinquency Despite High Cash Balances

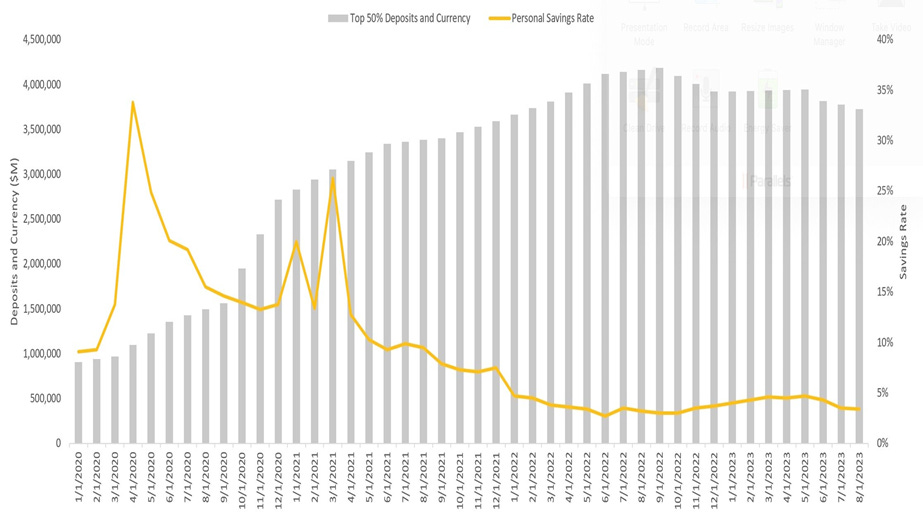
On January 22, I posted an article on consumer financial strength driven by the amount of cash consumers have in checkable deposits as reported by the Fed. If you look at the bottom 50% of households by wealth, they are sitting on an astounding 2.5x as much cash in their checking accounts as they had before the start of COVID. See the chart below.

Salvatore Tirabassi

You can see that the amount of cash peaked in September 2022 and has since been declining. The rate of decline though indicates that it will be some time before consumers get back to pre-COVID cash levels.

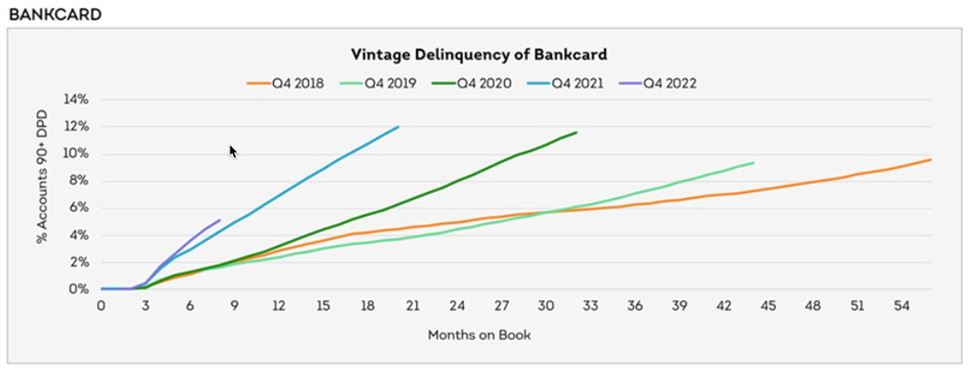
In January, Transunion reported that more recently issued credit cards are reaching high delinquency rates much earlier than expected. If you are new to consumer finance, we look at how credit performs from the date of issuance (also called a vintage) and that gives you the ability to compare how different issuance dates perform against each other.

Issuance dates closer to hard financial times should underperform the preceding issuance dates.

Let’s look at the Transunion delinquency chart.

Salvatore Tirabassi

This chart shows the percentage of credit cards (as a pool) issued in Q4 of each of the last 5 years to reach 90+ days delinquency (no payments in the last 90+ days). Each recent vintage pool has reached the level of delinquency of the previous vintage pool in a shorter period of time. For example, the orange line (Q4 2018 vintage pool) took 54 months to reach a delinquency rate of about 10%. Now look at the light blue line (Q4 2021 vintage pool). It took only 15 months to reach 10% delinquency. The most recent issuance date, the purple line (Q4 2022 vintage pool), is already at a faster pace than all previous vintage pools. Notice it is steeper than the light blue line that preceded it in Q4 2021.

If consumers are sitting on so much cash, why are credit cards going delinquent at a quickening rate?

There are many factors that could be at play here. Here are some of the drivers that I think are important.

  • The cash balances above reflect the bottom 50% of households, as a group. Hidden in that data are the stratifications of cash by household wealth, which would likely show lower cash savings as you move down to less wealthy households.

  • Similarly, the Transunion data above also groups all credit risk stratifications together. In a stratified view by credit risk wealth tier, you would likely see that the rates and pacing of delinquency will be higher and faster for lower-credit consumers.

  • The positive effects of COVID economics (higher wages, stimulus, new credit availability, savings from stay-at-home orders) are unwinding more quickly for the lower credit consumers.

This part of the market had the opportunity to spend more and put more on credit during COVID, and the banks were eager to bring new credit card accounts on. As the economy has gone back to normal over the last 24 months, these consumers have more regular demands on their cash, which took a backseat during COVID. Moreover, they now have credit card bills to address, which carry interest rates at the highest rates we have seen in years. The combination leads to increasing delinquencies, even though cash looks abundant.

 Reference: https://salvatoretirabassi.substack.com/p/cracks-in-consumer-credit-card-delinquency

Sunday, February 4, 2024

Unlocking Synergies: Elevating Data Science with Operations Research Expertise

 **Introduction:**

Who’s on a quest to develop advanced data science capabilities? One of my analytics team’s strategic expansion brought together diverse talents in statistics, applied math, and engineering. This case study explores the integration of operations research, fostering collaboration and knowledge diversity within analytics.

**Objective:**

Our primary goal was to blend diverse skill sets, creating an environment conducive to innovative problem-solving. While the envisioned integration remained a future prospect, immediate focus shifted to operations research for its promising prescriptive capabilities. 

**Operations Research Focus:**

Econometrics was another area if interest for time-series analytics, but operations research, tailored for data science programming and extensive datasets, emerged as a focal point. Excelling in solving objectives within specified constraints, it offered optimal solutions that set it apart from traditional machine learning models.

**Prescriptive Analytics vs. Predictive Analytics:**

Distinguish prescriptive analytics (operations research) from predictive analytics (machine learning). The former provides optimal solutions based on defined constraints, while the latter predicts outcomes based on historical data.

**Transportation Example:**

In a transportation scenario, predictive models analyze historical data for efficient routes. Operations research, however, prescriptively determines the least-cost path based on constraints, suggesting routes not traveled before. One other aspect of operations research and linear programming models is that they also handle revenue and expense variables quite well.

**Methodology and Insight:**

While both approaches may lead to similar conclusions, their methodologies diverge significantly. Predictive models embrace uncertainty, offering likely outcomes, while operations research precisely calculates optimal solutions, evaluating all possible choices.

**Data Science Synergy:**

Understanding this nuanced difference empowers an analyst or data scientist to approach problem-solving flexibly. Predictive models shine in uncertainty, providing choices based on learned experiences. Operations research excels with known inputs and complex combinations, delivering reliable solutions.

**Conclusion and Future Prospects:**

This case study illuminates the ongoing journey in cultivating a collaborative data science environment. As the capabilities of a team evolve, the prospect of adding talents like the previously mentioned econometrics, which excels in time-series forecasting, holds the promise of elevating capabilities to tackle even more complex challenges. Unleash the potential of data science synergy with operations research expertise! 

 🌐📈 #DataScience #OperationsResearch #AnalyticsSynergy #PrescriptiveAnalytics #PredictiveAnalytics #CaseStudy

 Reference:- http://tirabassi.com/

Recurring Revenue Modeling Can Be Tricky, Using Cancellation Curves Can Improve Precision And Results

  In a recent post on recurring revenue financial modeling, I covered some of the main drivers that play a role in the construction of finan...