On January 22, I posted an article on consumer financial strength driven by the amount of cash consumers have in checkable deposits as reported by the Fed. If you look at the bottom 50% of households by wealth, they are sitting on an astounding 2.5x as much cash in their checking accounts as they had before the start of COVID. See the chart below.
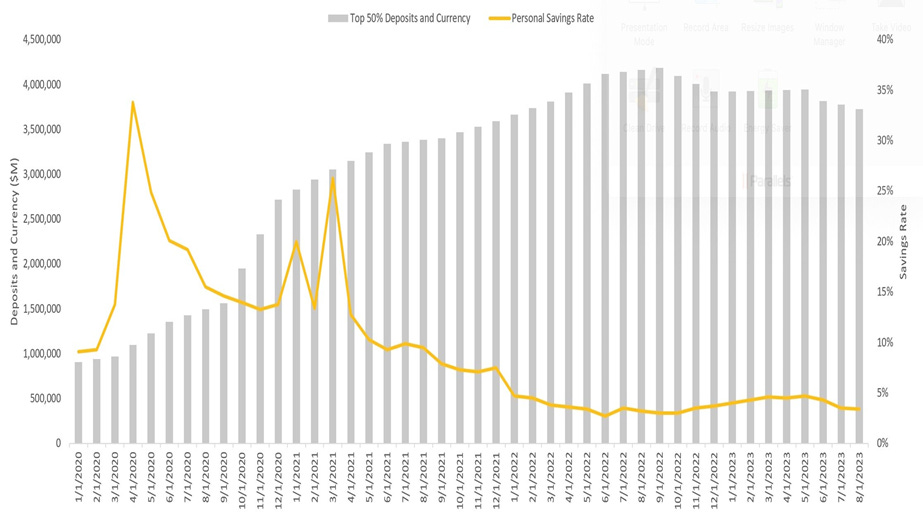
You can see that the amount of cash peaked in September 2022 and has since been declining. The rate of decline though indicates that it will be some time before consumers get back to pre-COVID cash levels.
In January, Transunion reported that more recently issued credit cards are reaching high delinquency rates much earlier than expected. If you are new to consumer finance, we look at how credit performs from the date of issuance (also called a vintage) and that gives you the ability to compare how different issuance dates perform against each other.
Issuance dates closer to hard financial times should underperform the preceding issuance dates.
Let’s look at the Transunion delinquency chart.
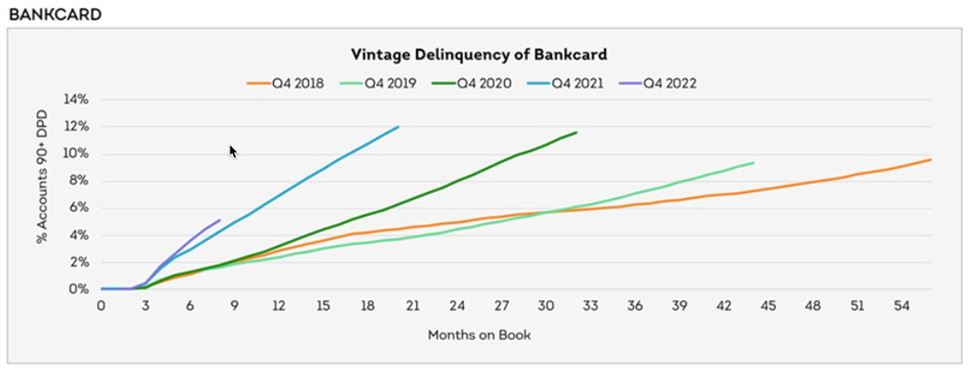
This chart shows the percentage of credit cards (as a pool) issued in Q4 of each of the last 5 years to reach 90+ days delinquency (no payments in the last 90+ days). Each recent vintage pool has reached the level of delinquency of the previous vintage pool in a shorter period of time. For example, the orange line (Q4 2018 vintage pool) took 54 months to reach a delinquency rate of about 10%. Now look at the light blue line (Q4 2021 vintage pool). It took only 15 months to reach 10% delinquency. The most recent issuance date, the purple line (Q4 2022 vintage pool), is already at a faster pace than all previous vintage pools. Notice it is steeper than the light blue line that preceded it in Q4 2021.
If consumers are sitting on so much cash, why are credit cards going delinquent at a quickening rate?
There are many factors that could be at play here. Here are some of the drivers that I think are important.
The cash balances above reflect the bottom 50% of households, as a group. Hidden in that data are the stratifications of cash by household wealth, which would likely show lower cash savings as you move down to less wealthy households.
Similarly, the Transunion data above also groups all credit risk stratifications together. In a stratified view by credit risk wealth tier, you would likely see that the rates and pacing of delinquency will be higher and faster for lower-credit consumers.
The positive effects of COVID economics (higher wages, stimulus, new credit availability, savings from stay-at-home orders) are unwinding more quickly for the lower credit consumers.
This part of the market had the opportunity to spend more and put more on credit during COVID, and the banks were eager to bring new credit card accounts on. As the economy has gone back to normal over the last 24 months, these consumers have more regular demands on their cash, which took a backseat during COVID. Moreover, they now have credit card bills to address, which carry interest rates at the highest rates we have seen in years. The combination leads to increasing delinquencies, even though cash looks abundant.
Reference: https://salvatoretirabassi.substack.com/p/cracks-in-consumer-credit-card-delinquency


No comments:
Post a Comment