Tradery Labs
I recently had the pleasure of doing some advisory and coaching work with a startup called Tradery Labs.
Tradery Labs is bringing futuristic predictive-modeling techniques into a highly honed system that will democratize the use of predictive algorithmic trading. The company’s goal is to give an investor the tools needed to build and test their own algorithms without the need for data scientists and programmers. More on that in a future post.
I recently sat down with Tradery’s head of modeling, Angel Aponte, to talk shop about his latest models in crypto futures.
Some Background on Bitcoin Futures
Unlike stocks where you can “sell short” and bet against the value of a stock, there is no concept of “selling short” actual
bitcoin, you can only buy it or not hold it. The futures market for
bitcoin changed all of that in 2017 and enabled traders to financially
take a positive or negative position on bitcoin. These bitcoin futures
enable traders to align their investment with their view on where
bitcoin is headed. That is, traders sell futures when they expect
bitcoin to decline and traders buy futures when they expect bitcoin to
increase.
What are the goals of latest Tradery Labs algorithm?
Tradery
has some lofty goals: the current algorithm targets a 50% annual return
on investment and tries to achieve the following objectives:
Beat a buy and hold on the base asset
Have more winning months than losing months
The largest winning month needs to be bigger than the largest losing month
Worst case drawdown (singular decline in value) of 20%
Make money when the market goes up and when it goes down
Product profit overall
Like all predictive model builders, Tradery is in continuous improvement mode. The model never gets to perfection. In financial markets, this is especially important because the volatility of markets creates opportunities for new trends with new causes to develop that new information can be used to retrain a predictive model to improve its accuracy.
Testing Models
Predictive
modelers always test different approaches to achieve their objectives.
Tradery tested both statistical and deep learning methods for this
latest project. Statistical techniques use mathematical models to
predict outcomes, while deep learning methods use an algorithm to learn
from the available data to make predictions. Both techniques have a rich
ecosystem of free software libraries that enable flexible model
building. The key is to have reliable, reproducible tests, that you can
iterate over quickly, and then validate those results in the real world.
All strategies that test successfully need to be followed by months of
real-world results, before trading them live with real money at stake.
Testing does not necessarily produce clear cut winning models. Modern techniques are so advanced that the top models are usually comparable. Tradery finds that models vary in deciding when to put capital at risk and then de-risk (ie, buying and selling). Some techniques do better in uptrends, some do better in downtrends, and some perform best when the market trading in a range (i.e., generally moving sideways). Over a period of time, these are the only three options that a market can be in, which makes choosing on a small differences between models challenging. In this exercise, Tradery’s winning model is based on statistical techniques, not deep learning, which might be a surprise to people.
Model Performance
Tradery
backtests its model using historical data that the model has never seen
before to see how well it does in its predictions. This means that the
model gets tested using data it has never seen before and its ability to
make predictions is repeatedly tested to rate how well it will perform
in real life.
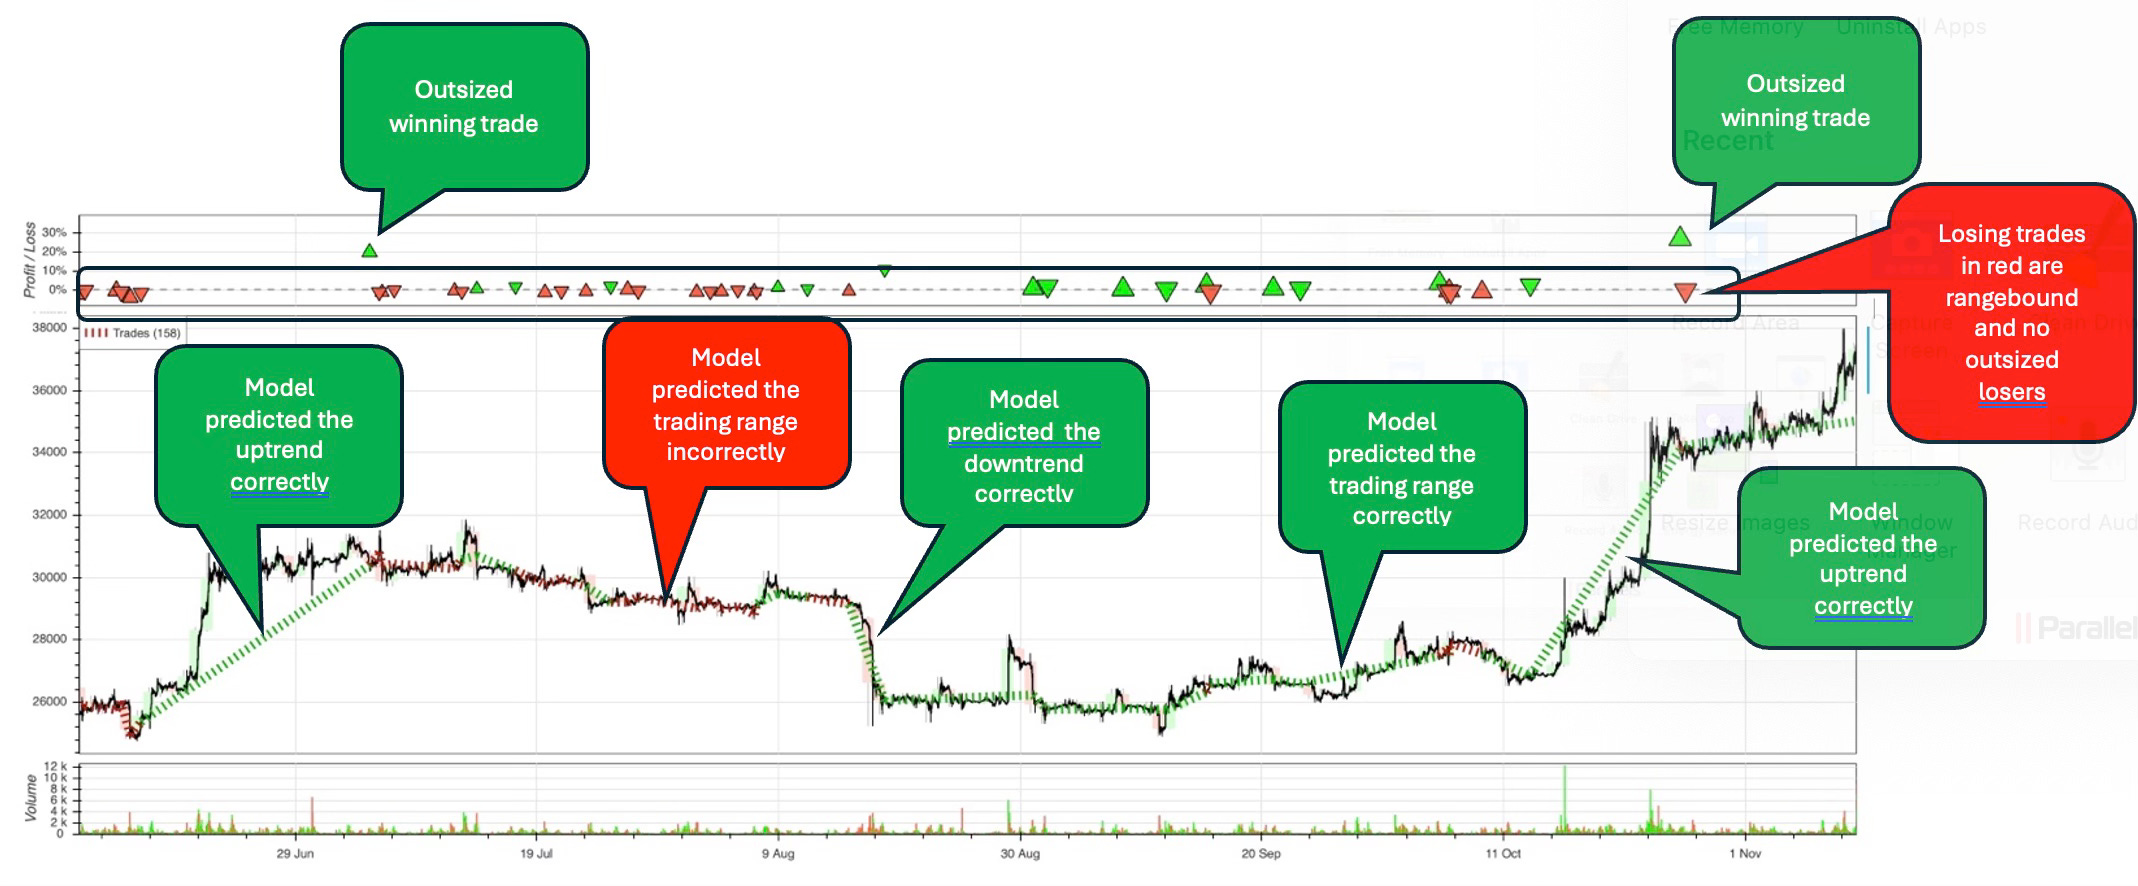
The picture below shows how the model
has done in backtesting. You can see that the model performed very well
predicting the outcomes using data it had never seen before. Green
bubbles and dotted lines means good, while read means bad.
Notice
the outsized winning trades and the lack of outsized losers at the top
of the picture. Those are the upward pointing green arrow heads. There
are two in particular that are well above the mixed green and red arrows
that are in a tight range. Those two arrow heads show two trades that
drove the big uptrends in performance.
In the lower portion of the picture, note the positive returns in green for market movements going up and down. This means the model is picking the right position based on expectations of increasing and decreasing prices.
Also, note that the model positioned the trades incorrectly in a sideways market as shown in red on the left. You can see the red dotted line (zoom in) which shows losses in sideways market movement.
In this data set, the model was not wrong about any big swings, which is why there are no outsized losing trades, as stated earlier. However, this particular model did not make winning decisions when the market moved sideways.
Findings and Takeaways
Angel Aponte provided some insights into important observations from the process.
The market adapts and evolves over time.
Therefore, a model’s performance will degrade over time. In addition, more traders are coming into these emerging futures markets and those new entrants create dynamics that change rapidly. As a result, the team must continually test new models and retrain existing ones.
Another important finding indicates that faster and more frequent trading is not necessarily better.
One might think that high velocity trading is a natural outcome of these kinds of models, but the trading signal that the model seeks can get noisy in short intervals making quick decisions unreliable.
In addition, the cost of commissions is an important factor when trading algorithmically. You can have a highly accurate model that loses money on the trading commissions, so including that cost in back tests is important. This is another costs that works against high-velocity trading. A model needs to cover its transaction costs to be successful.
I will report back on live trading results using these algorithms in sometime in the future.
Visit Tradery Labs here.
Reference: https://shorturl.at/jpyQ7


No comments:
Post a Comment