As discussions go round and round regarding the potential impact of consumer finances on an impending recession or a more gradual "soft landing," recent media narratives have brought attention to a remarkable surge in the savings rate following the COVID-19 pandemic.
While the savings rate serves as a useful metric, providing insights into where consumers are directing their excess cash, it falls short in offering a nuanced understanding of the actual cash buildup. Recently disclosed data has ushered in a paradigm shift, challenging preconceived notions about consumer savings. The revelation suggests that consumers have saved more cash than previously estimated, with reported savings rates reaching 15.4% in 2020 and 11.4% in 2021—figures that are undeniably significant.
Prompted by this new data report, my focus has been directed towards the Federal Reserve's reporting on Currency and Checkable Deposits, a comprehensive analysis tracking the ebb and flow of cash in checking accounts. This alternative data perspective paints a more optimistic picture of the consumer's financial standing, revealing that the average US consumer is holding multiples of cash compared to pre-COVID levels. This newfound understanding underscores the robustness and sustainability of consumer balances, fueled by higher average savings rates.
Let's explore how Currency and Checkable Deposits have evolved for different segments of the population, particularly the Bottom 50% and Top 50% of households.
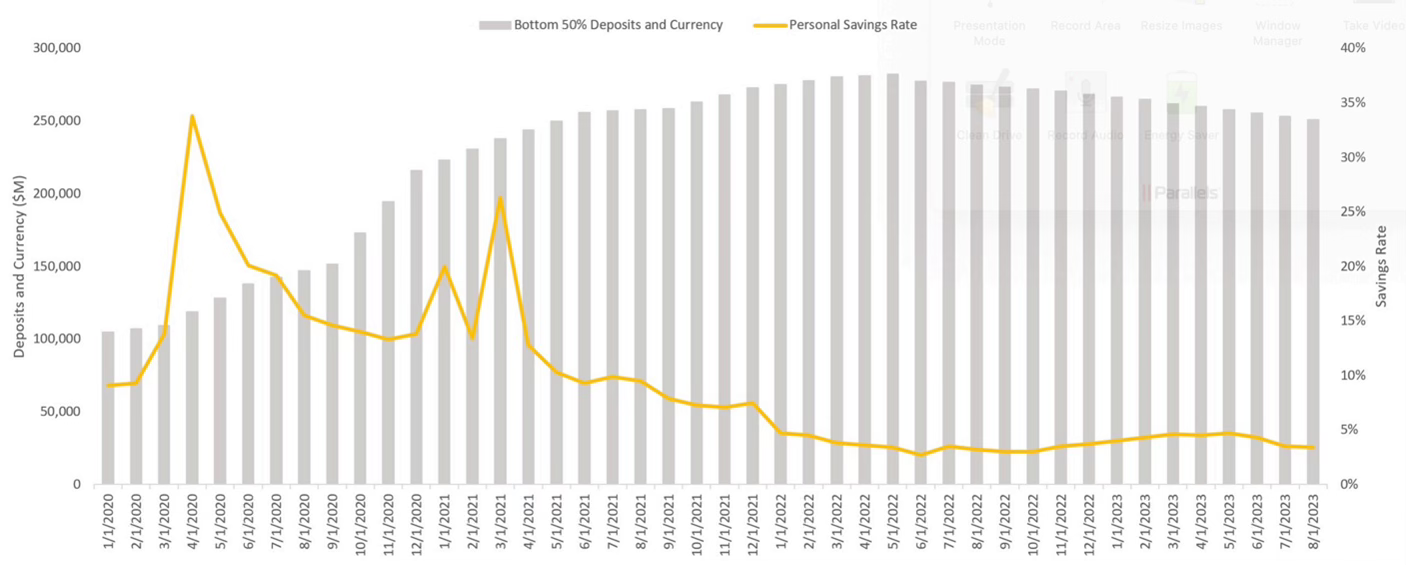
Cash and checkable deposits for the bottom 50% of households by wealth. Federal Reserve, 2023.
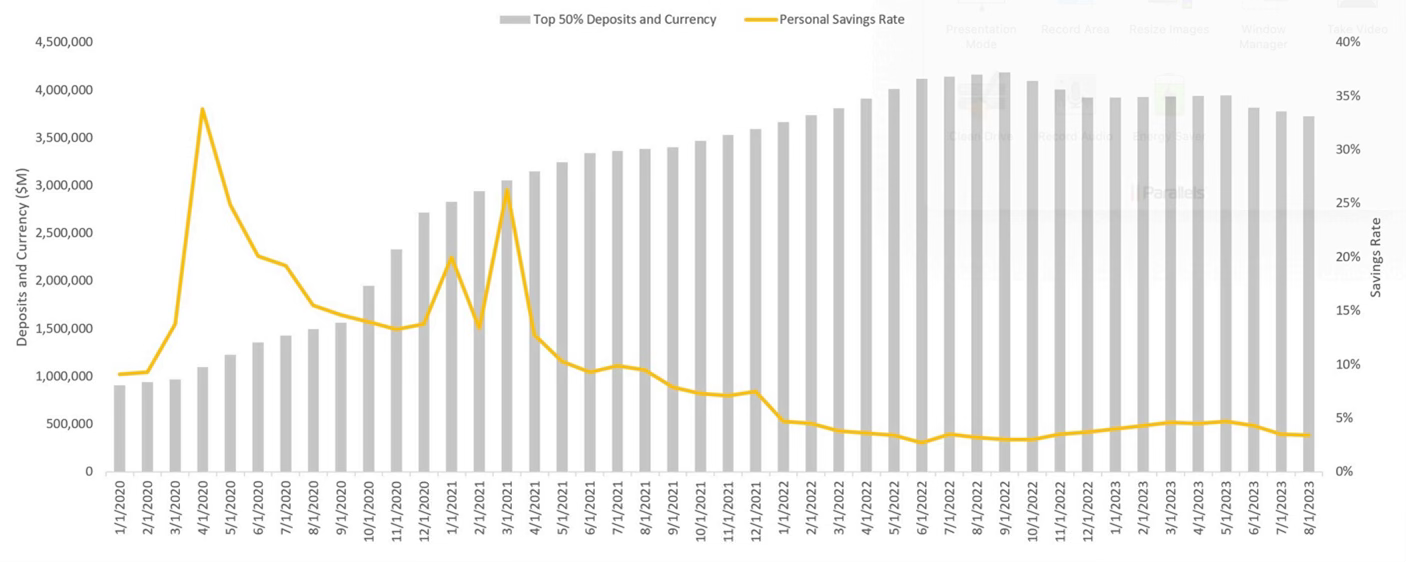
Cash and checkable deposits for the top 50% of households by wealth. Federal Reserve, 2023.
The charts vividly illustrate the substantial growth in cash availability, with the Bottom 50% experiencing a 2.5x increase from January 2020 to August 2023, and the Top 50% boasting over 3.5x more cash during the same period. Intriguingly, both groups have begun consuming their accumulated cash, a trend that commenced in June 2022 for the bottom 50% and October 2022 for the top 50%.
These data points collectively paint a comprehensive picture, indicating that, on average, US consumer balance sheets remain resilient and robust. The runway for these balance sheets to return to pre-COVID cash levels appears long. However, it's crucial to acknowledge that these are averages across all households, and the sustainability of cash levels varies by the decile of wealth.
In dissecting this narrative further, it becomes evident that the erosion of cash is not uniform and is likely to follow a bottom-up trajectory. This divergence is observable as the bottom 50% experiences negative growth since June 2022, preceding the top 50% that exhibits similar trends from October 2022. The implication is that less affluent households might feel the impacts of a potential recession earlier than their wealthier counterparts.
As we navigate the complex terrain of economic forecasting, it's essential to recognize that while consumer balance sheets play a role, they may not emerge as the primary driver of an economic slowdown. Other economic factors, such as hiring trends, wage dynamics relative to inflation, and industrial output, are anticipated to wield a more substantial influence in shaping the trajectory of the economic slowdown.
Reference: https://shorturl.at/uJLO1


No comments:
Post a Comment